Credit Stress Index (US)
A monthly, state-level view of credit and financial stress. Built to be explainable, auditable, and safe to operationalize.
Markets move fast. State economies don’t move in sync. If you’re tracking macro, housing, or consumer credit, you often need a simple way to answer. Which states are getting worse, and why?
If you track macro, housing, or consumer credit, this gives you a consistent monthly view of stress by state, plus the drivers behind the moves.
Credit Stress Index is a 0 to 100 score where higher means worse. It updates monthly for every state plus DC. Use it to compare states over time and see what is driving the change. Every release is versioned and includes QA checks, data quality reporting, and integrity checks so you can use it without guessing what changed.
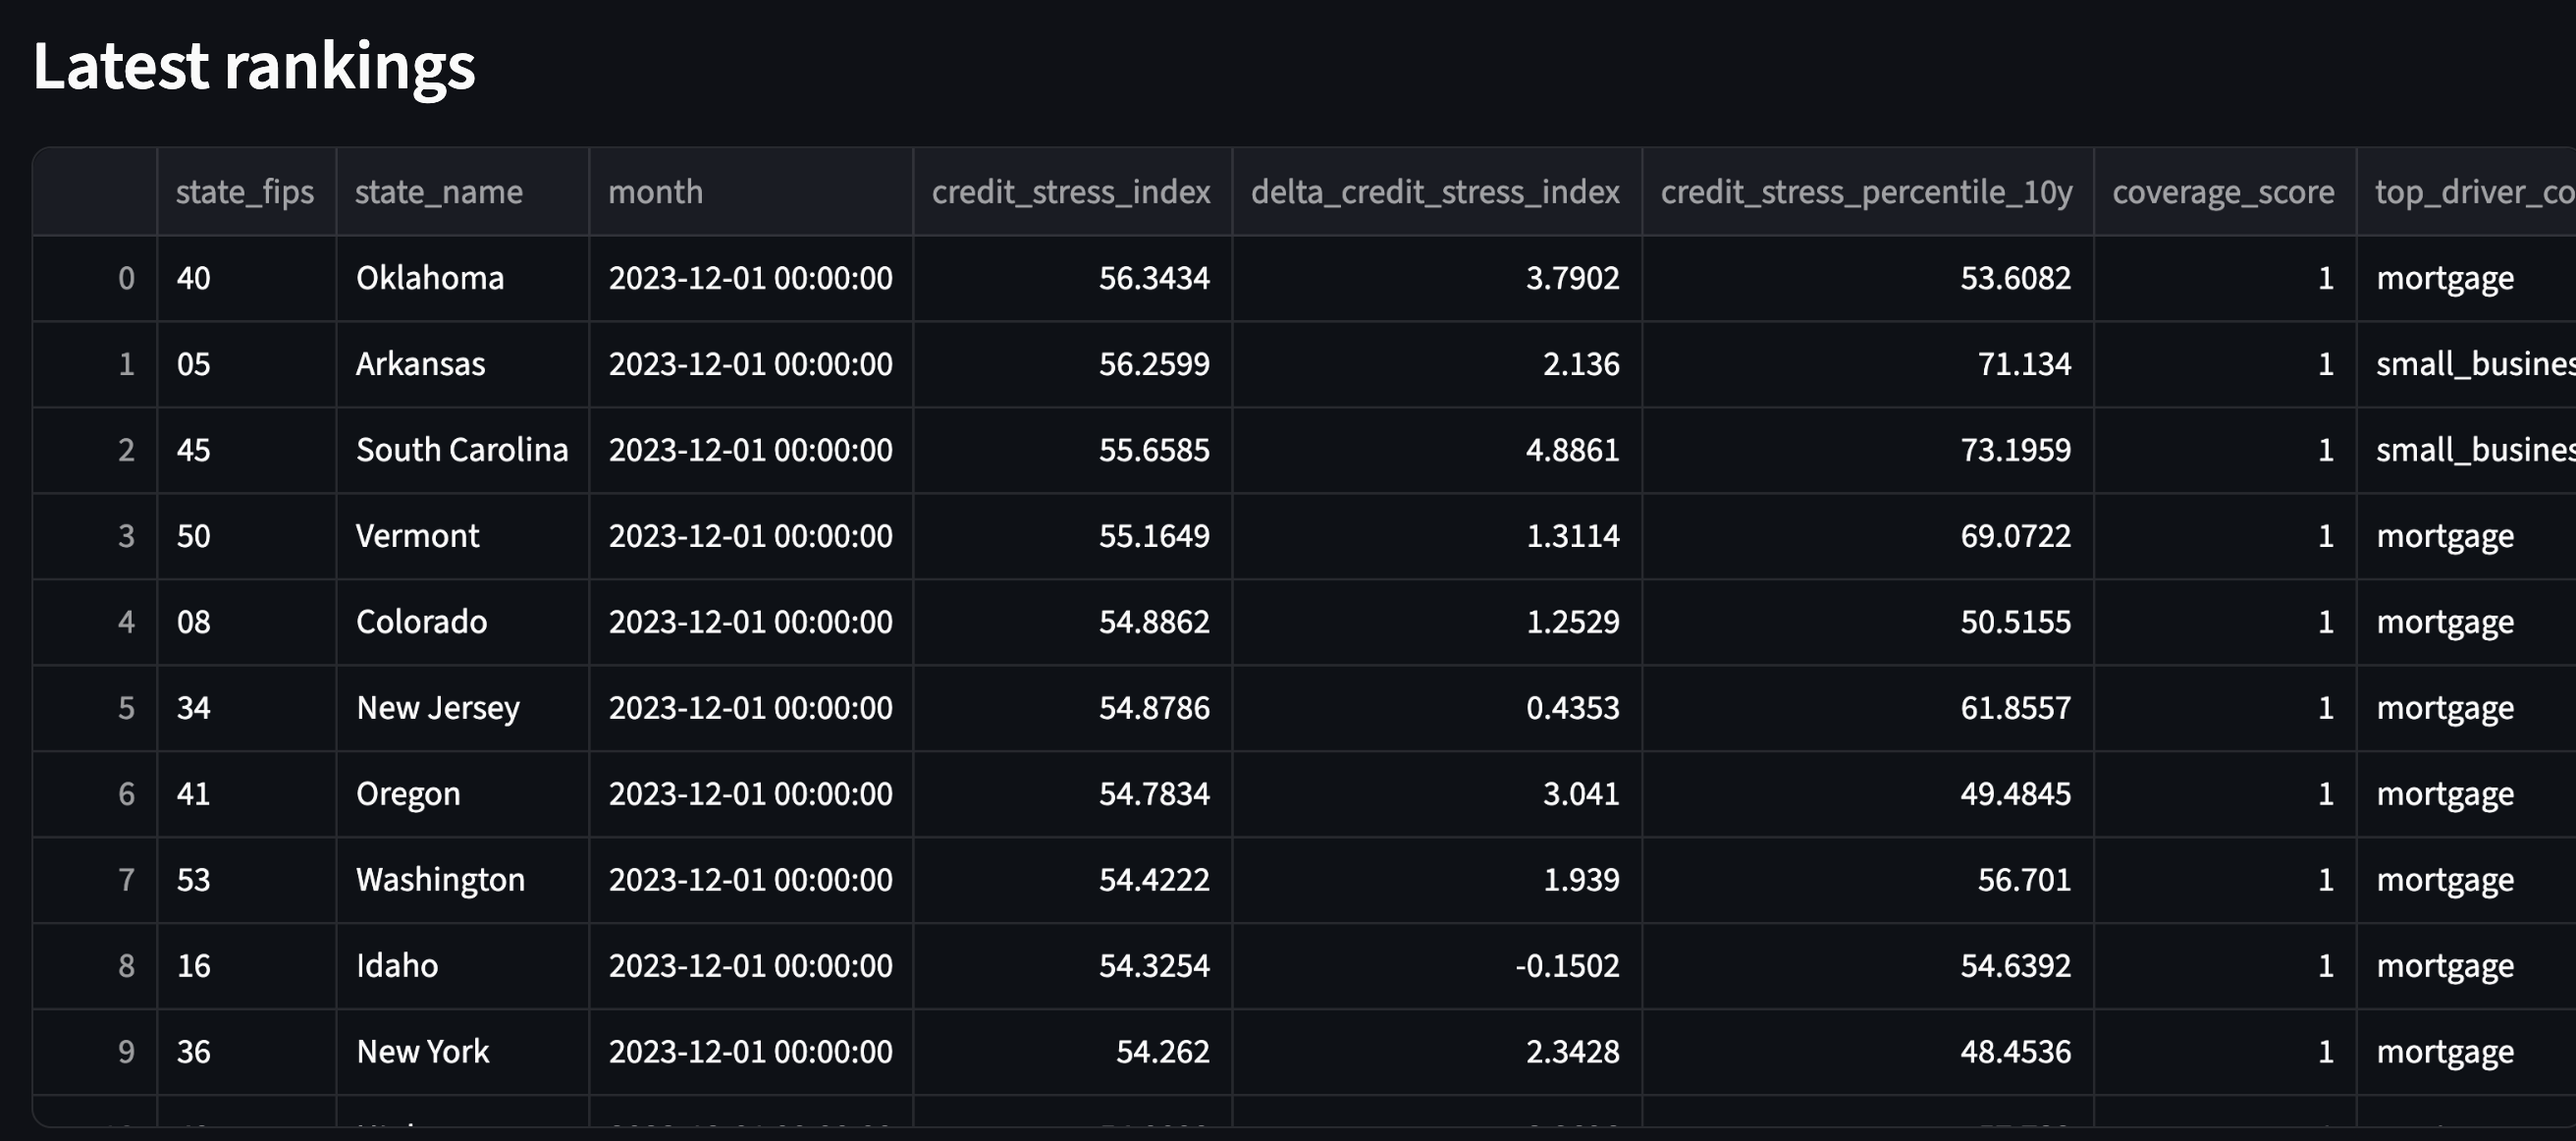
A latest-month leaderboard that answers a simple question. Which states look most stressed today?
Pro tip. Start with coverage_score >= 0.75 so you compare like with like.
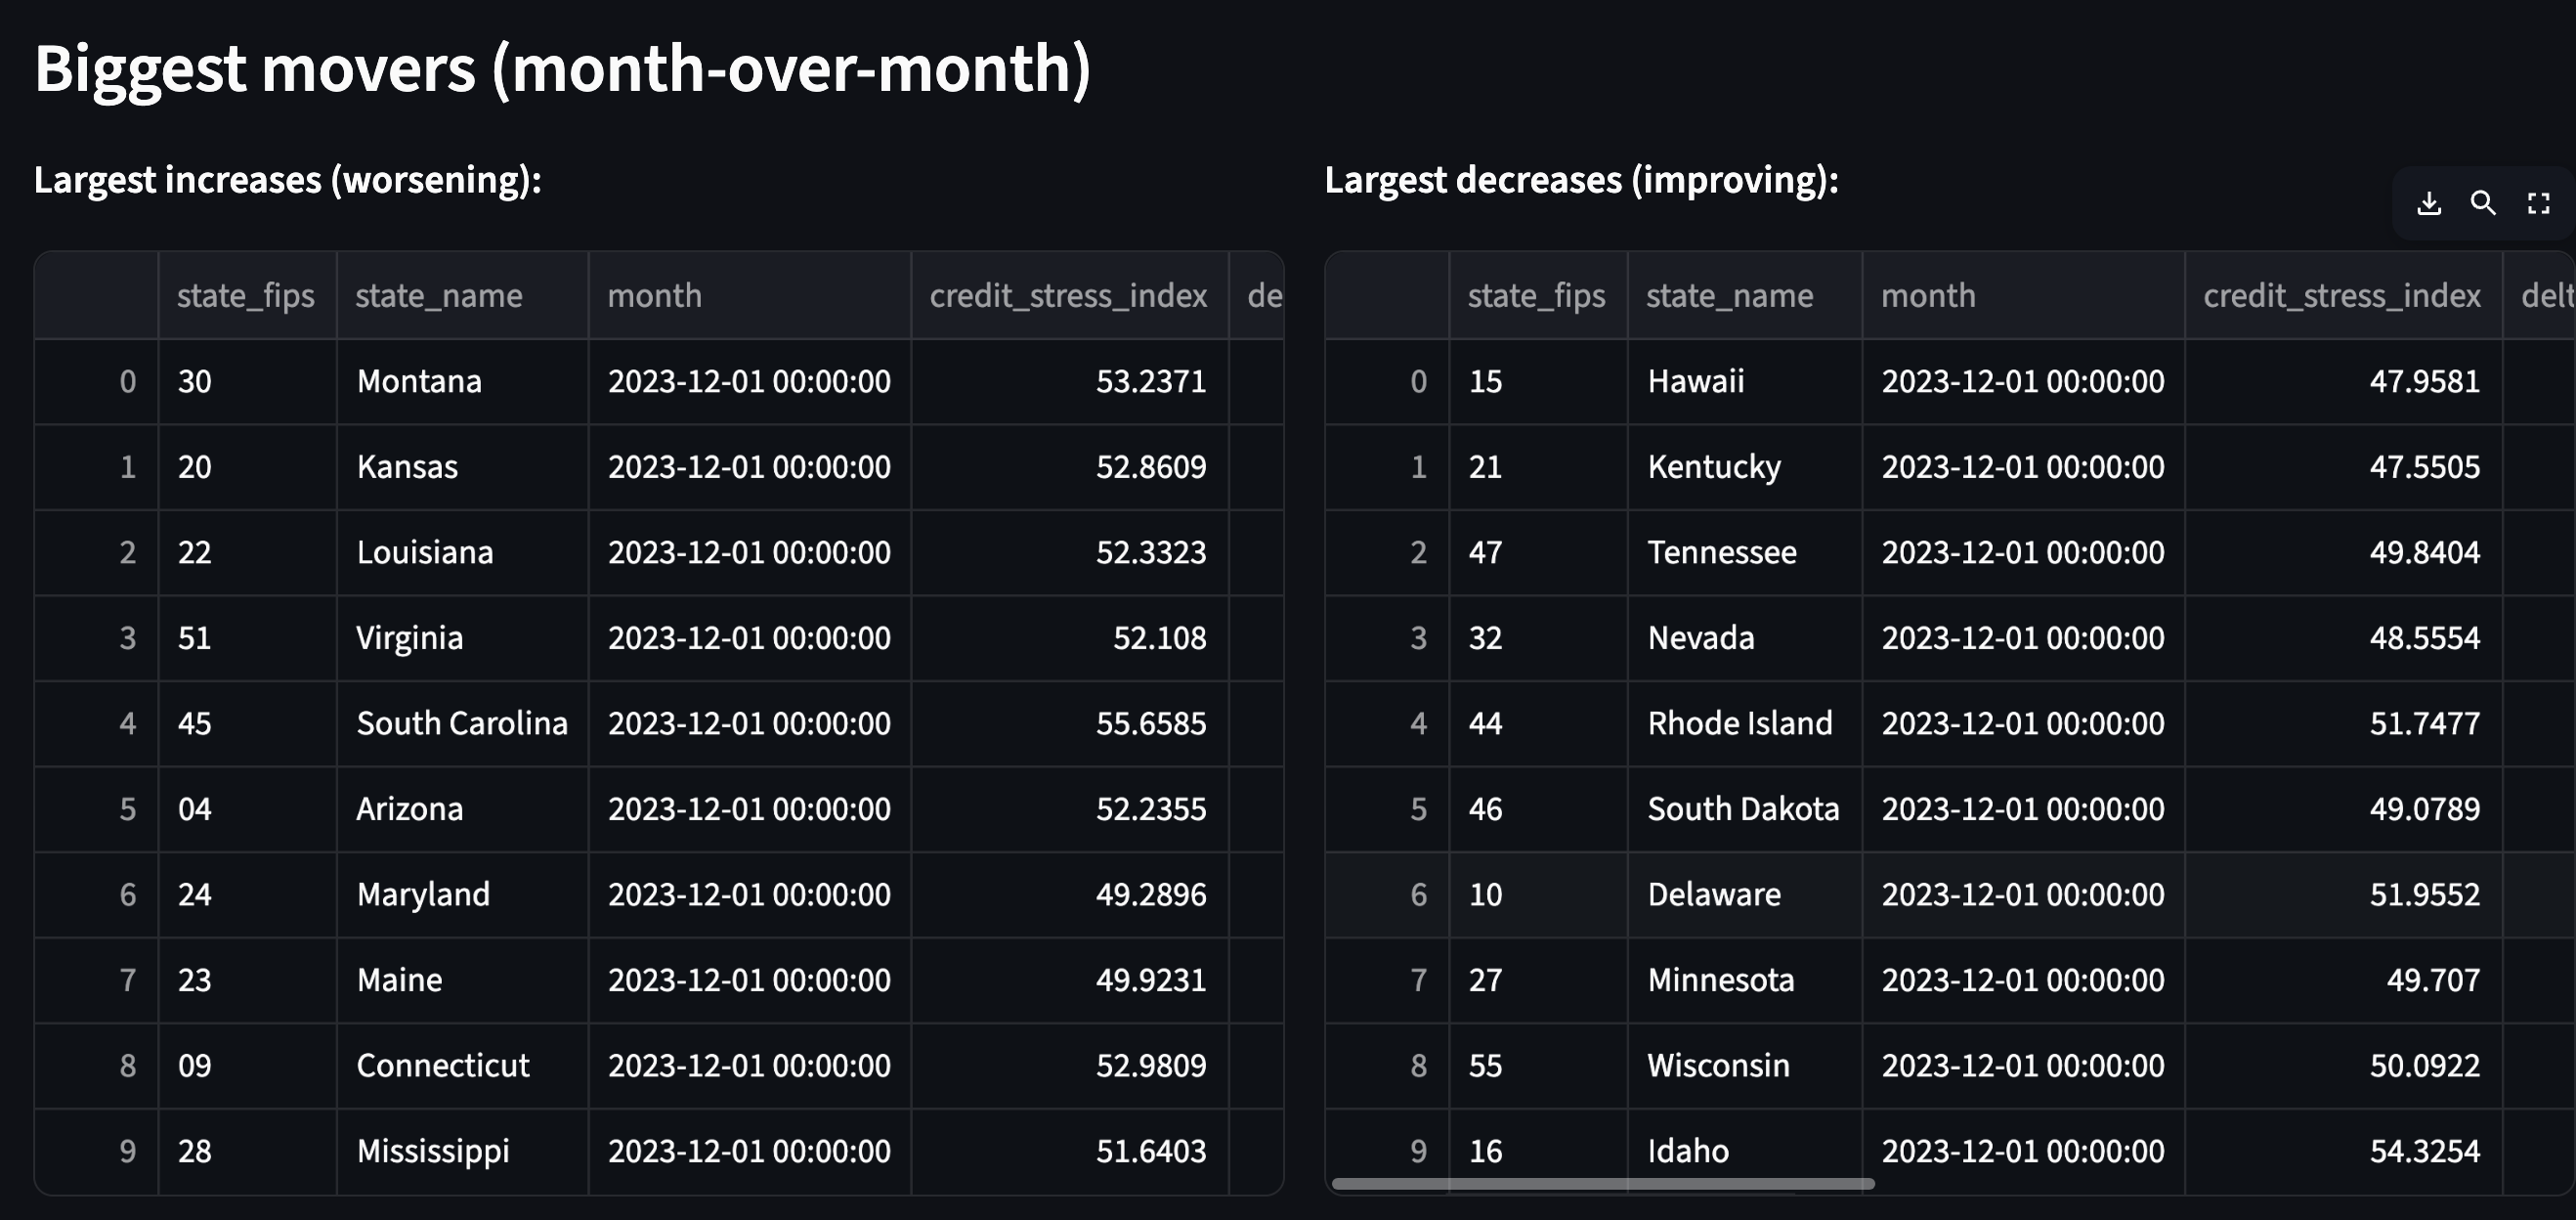
Track month-over-month movement with delta_credit_stress_index (this month − previous month). Positive means worsening. Negative means improving.
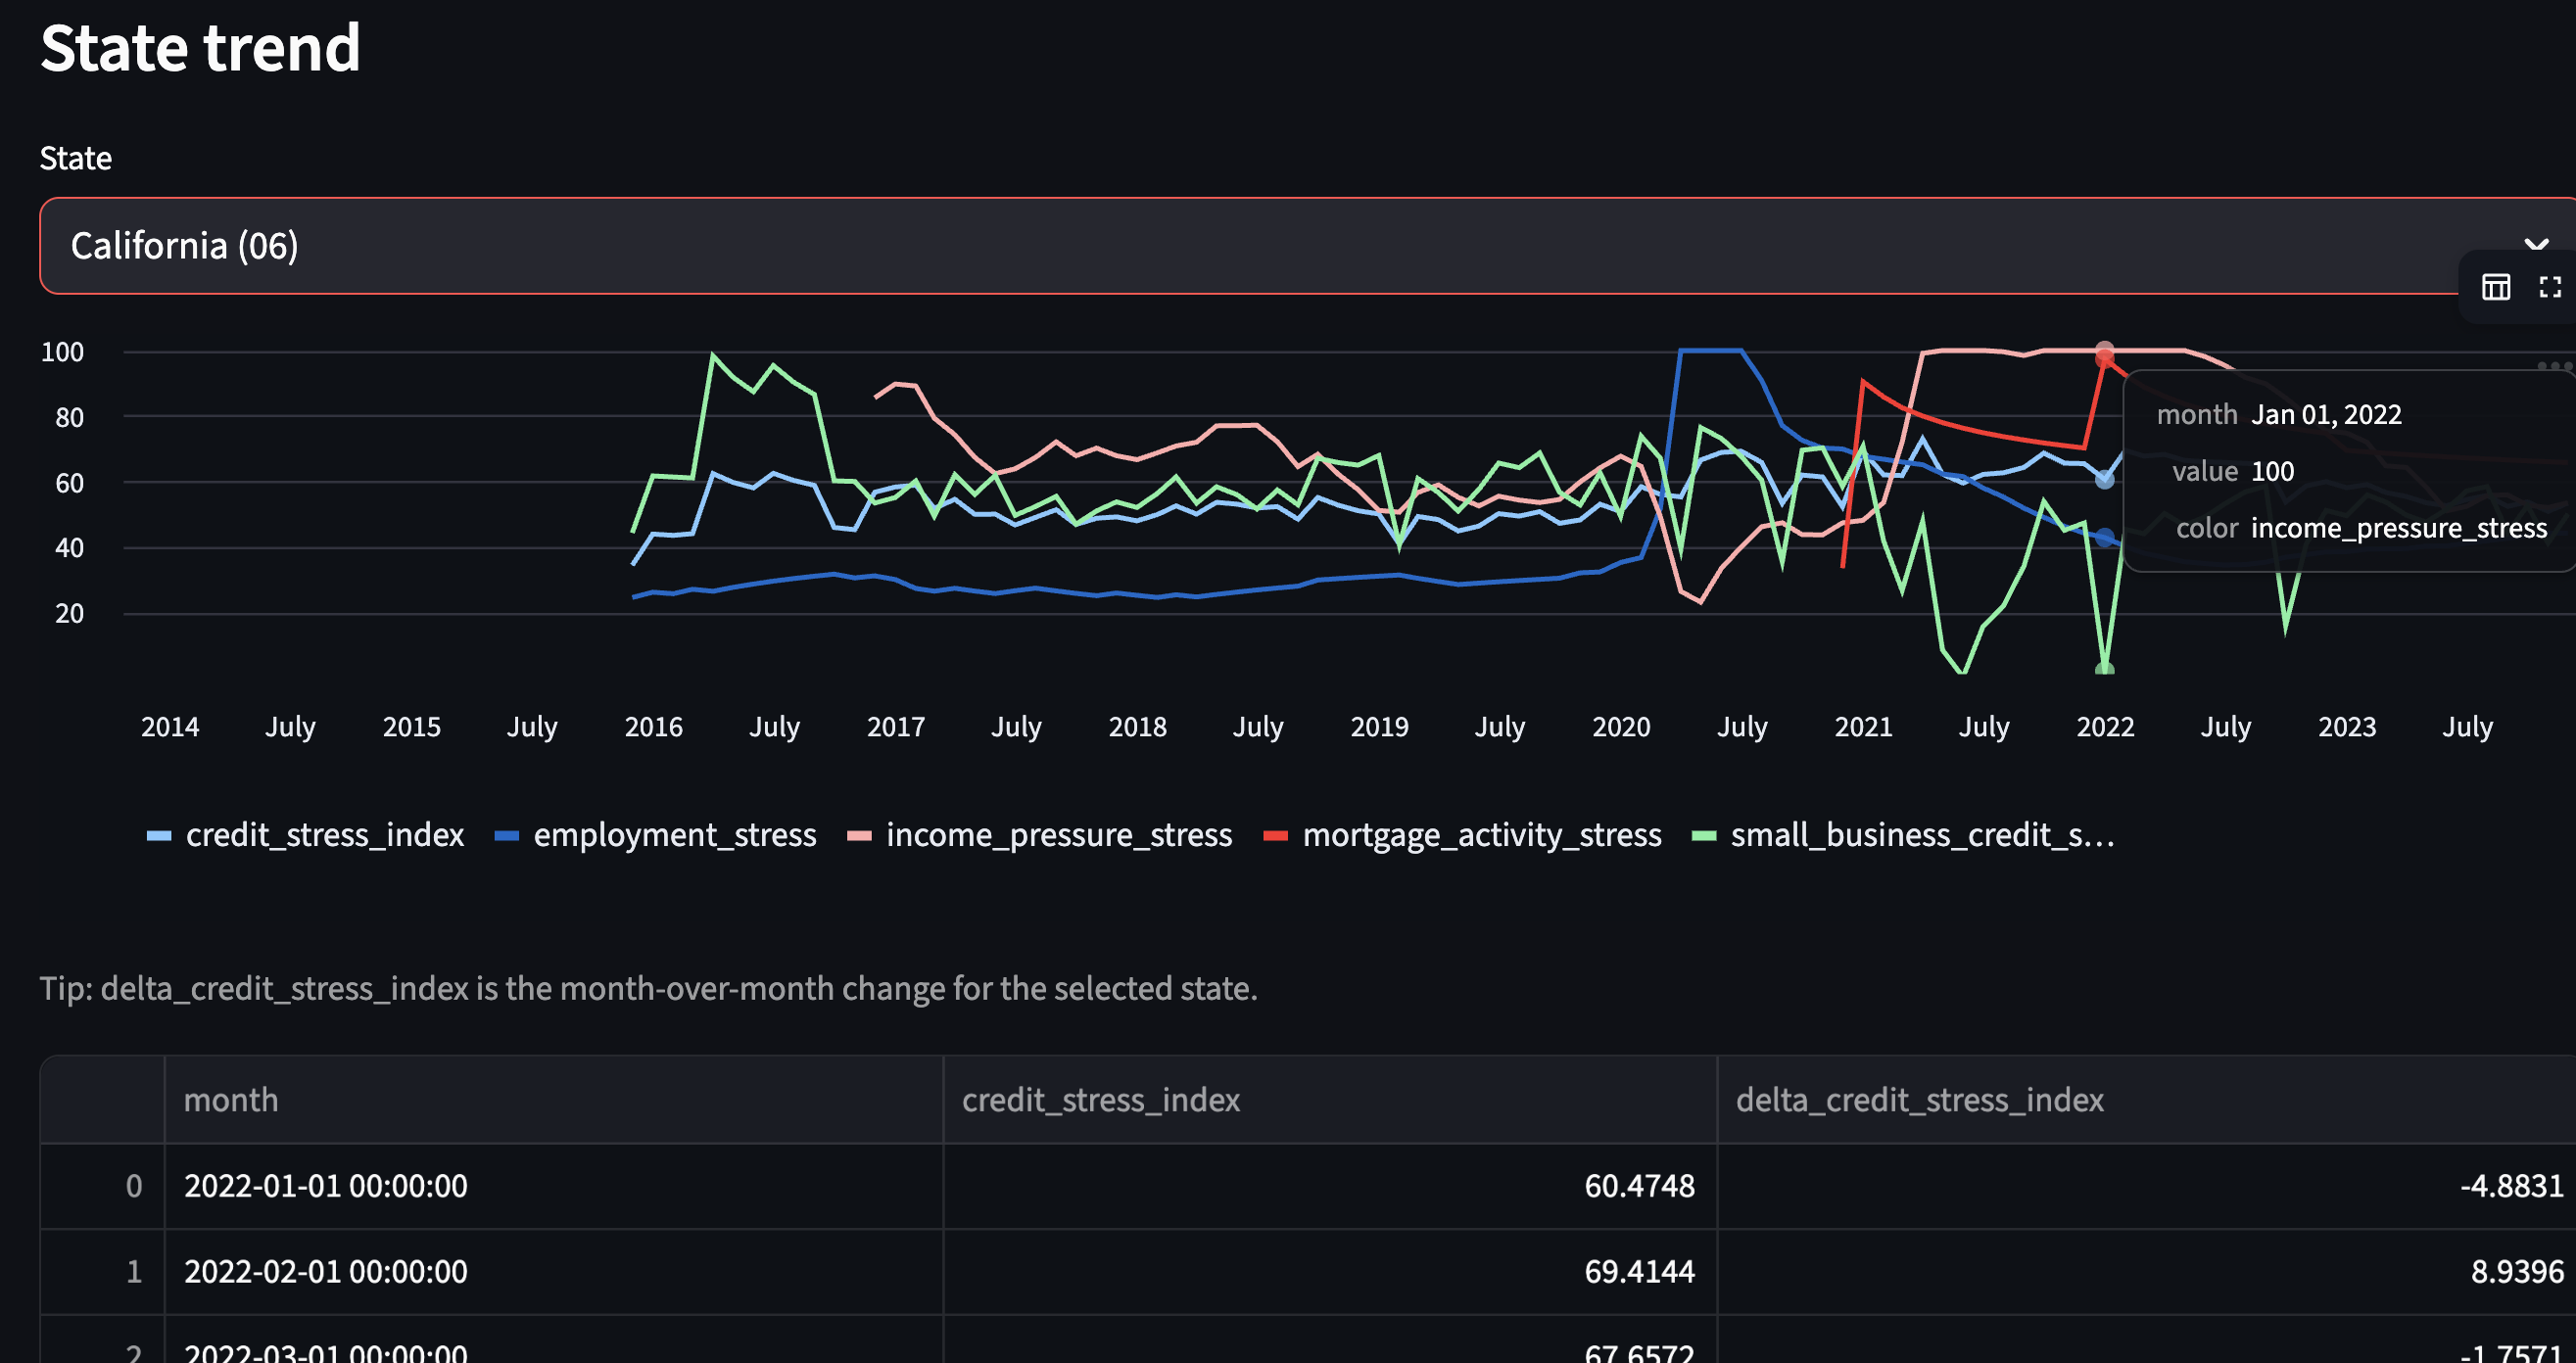
A state time series with the index and its components. It also includes deltas for the last 24 months, which is great for notes, briefings, and dashboards.
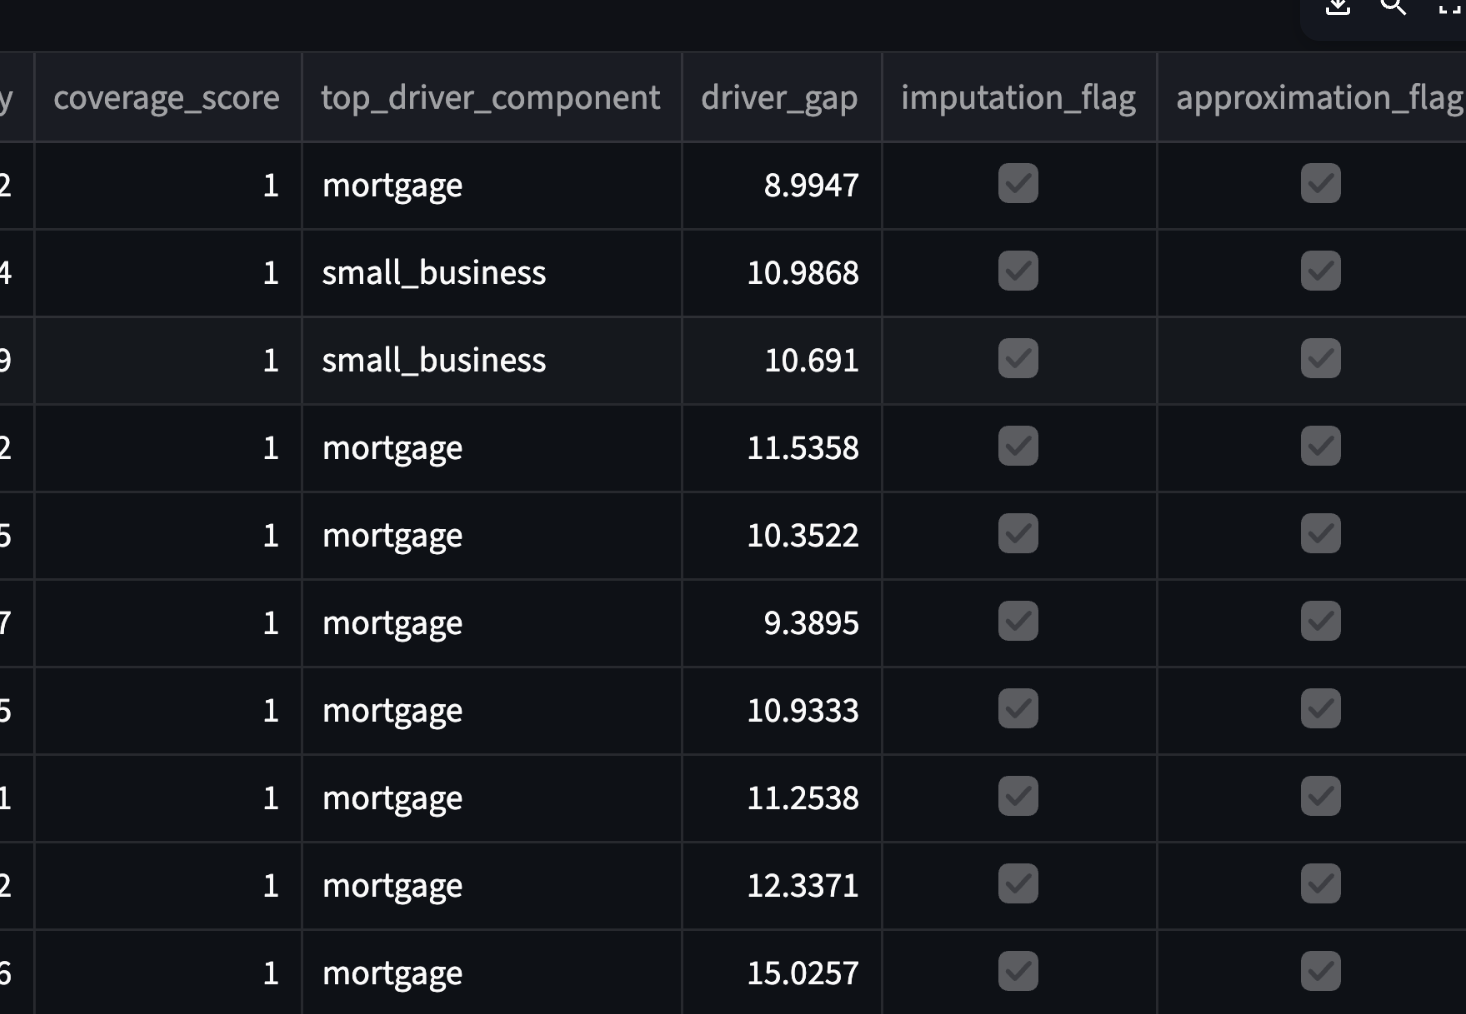
Every row includes coverage_score plus quality flags, so you can filter intentionally.
imputation_flag= frequency expansion/fill (e.g., quarterly→monthly)approximation_flag= proxy/replication
Representative workflows. These are not customer testimonials. Copy them into your process and adapt.
Where is stress highest, what changed, and what’s driving it?
- Open Rankings (latest month).
- Check Movers (month-over-month change).
- Explain with components + top driver (and note coverage/flags).
Turn the dataset into lightweight signals, with guardrails to avoid noisy coverage.
- Alert on
delta_credit_stress_indexabove a threshold. - Include a trend chart for index + components.
- Default filter is
coverage_score >= 0.75.
For teams who need a fast, explainable read on regional stress, with enough release discipline to operationalize.
delta_credit_stress_index (momentum) + coverage_score (confidence).A versioned release bundle you can archive and audit. Data, documentation, and QA artifacts included.
Monthly subscription. Delivered by email with a secure, expiring download link each release.
- Subscribe via Stripe.
- Use your preferred delivery email at checkout.
- Get a secure, expiring link by email for each release.
- Download + verify using checksums included in the package.
More detail on methodology and flags
Pipeline is structured as raw → staging → components → final. Releases are QA-gated to enforce a stable contract.
- Imputation = frequency expansion/fill (e.g., quarterly→monthly), flagged via
imputation_flag. - Approximation = proxy/replication when a state series isn’t available, flagged via
approximation_flag. - coverage_score is a 0 to 1 indicator of component availability. Recommended default filter is
coverage_score >= 0.75.